管理内存
本文介绍如何管理并调优内存资源。
查看内存使用
您可以通过以下方法查看分析 BE 内存使用。
- 通过浏览器或 curl 命令访问 Metrics 接口分析内存使用。
Metrics 统计每 10 秒更新一次。
curl -XGET -s http://be_ip:8040/metrics | grep "^starrocks_be_.*_mem_bytes\|^starrocks_be_tcmalloc_bytes_in_use"
说明:
- 将以上
be_ip改为 BE 节点实际的 IP 地址。- BE
be_http_port默认为8040。
对应指标的含义参考 内存分类。
- 通过浏览器或 curl 命令访问 mem_tracker 接口分析 BE 内存使用。
http://be_ip:8040/mem_tracker
说明:
- 将以上
be_ip改为 BE 节点实际的 IP 地址。- BE
be_http_port默认为8040。
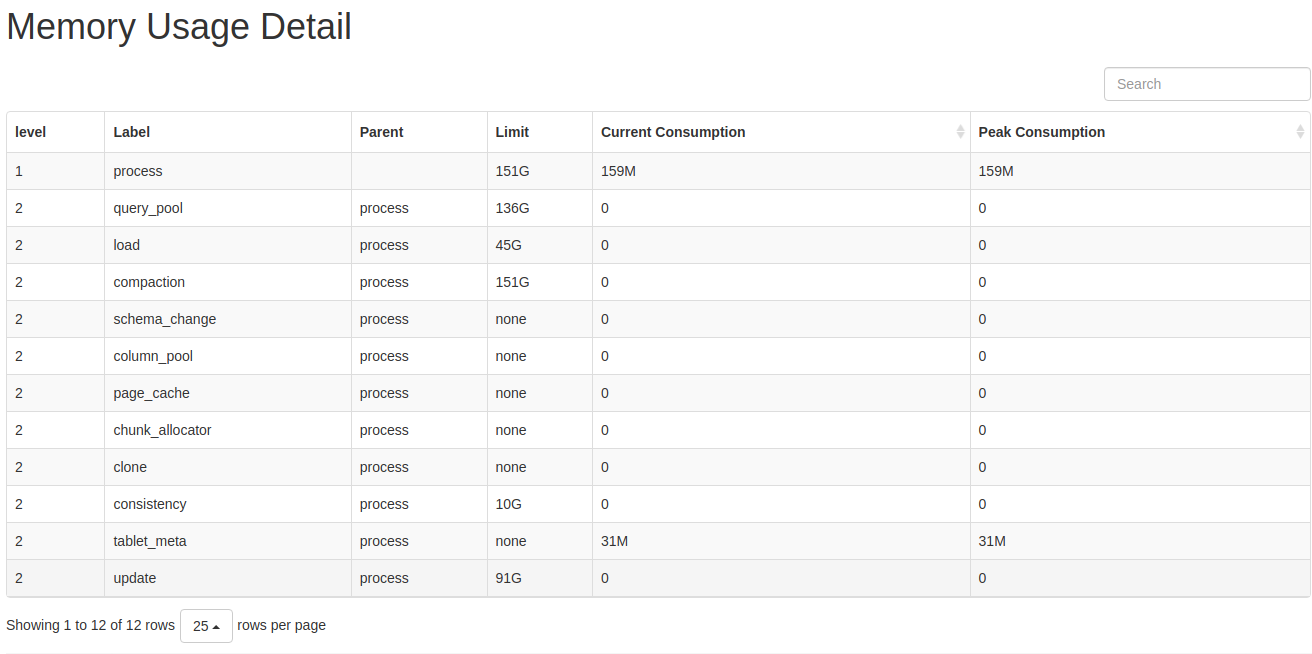
指标说明:
-
level: MemTracker 为树型结构,第一级为 BE 使用总内存,第二级为分类内存使用。 -
Label: 标识内存分类,对应指标的含义参考 内存分类。 -
Parent: 父结点 Label。 -
Limit: 内存使用限制,-1表示没有限制。 -
Current Consumption: 当前内存使用�。 -
Peak Consumption: 峰值内存使用。 -
通过浏览器或 curl 命令访问 TCmalloc 接口分析 BE 内存使用。
http://be_ip:8040/memz
说明:
- 将以上
be_ip改为 BE 节点实际的 IP 地址。- BE
be_http_port默认为8040。
示例:
------------------------------------------------
MALLOC:      777276768 (  741.3 MiB) Bytes in use by application
MALLOC: +   8851890176 ( 8441.8 MiB) Bytes in page heap freelist
MALLOC: +    143722232 (  137.1 MiB) Bytes in central cache freelist
MALLOC: +     21869824 (   20.9 MiB) Bytes in transfer cache freelist
MALLOC: +    832509608 (  793.9 MiB) Bytes in thread cache freelists
MALLOC: +     58195968 (   55.5 MiB) Bytes in malloc metadata
MALLOC:   ------------
MALLOC: =  10685464576 (10190.5 MiB) Actual memory used (physical + swap)
MALLOC: +  25231564800 (24062.7 MiB) Bytes released to OS (aka unmapped)
MALLOC:   ------------
MALLOC: =  35917029376 (34253.1 MiB) Virtual address space used
MALLOC:
MALLOC:         112388              Spans in use
MALLOC:            335              Thread heaps in use
MALLOC:           8192              Tcmalloc page size
------------------------------------------------
Call ReleaseFreeMemory() to release freelist memory to the OS (via madvise()).
Bytes released to the OS take up virtual address space but no physical memory.
�指标说明:
Bytes in use by application: BE 实际使用的内存。Bytes in page heap freelist: BE 已不再使用,但是尚未归还给操作系统的内存。Actual memory used: 操作系统监测到 BE 实际内存使用(BE 会预留一些空闲内存,不还给操作系统或是缓慢返还给操作系统)。Bytes released to OS: BE 已设置为可回收状态,但是操作系统尚未回收的内存。
内存分类
StarRocks BE 中的内存分为以下几类。
| 标识 | Metric 名称 | 说明 | BE 相关配置 |
|---|---|---|---|
| process | starrocks_be_process_mem_bytes | BE 进程实际使用的内存(不包含预留的空闲内存)。 | mem_limit |
| query_pool | starrocks_be_query_mem_bytes | BE 查询层使用总内存。 | |
| load | starrocks_be_load_mem_bytes | 导入使用的总内存。 | load_process_max_memory_limit_bytes, load_process_max_memory_limit_percent |
| table_meta | starrocks_be_tablet_meta_mem_bytes | 元数据总内存。 | |
| compaction | starrocks_be_compaction_mem_bytes | 版本合并总内存。 | compaction_max_memory_limit, compaction_max_memory_limit_percent |
| column_pool | starrocks_be_column_pool_mem_bytes | column pool 内存池,用于加速存储层数据读取的 Column Cache。 | |
| page_cache | starrocks_be_storage_page_cache_mem_bytes | BE 存储层 page 缓存。 | disable_storage_page_cache, storage_page_cache_limit |
| chunk_allocator | starrocks_be_chunk_allocator_mem_bytes | CPU per core 缓存,用于加速小块内存申请的 Cache。 | chunk_reserved_bytes_limit |
| consistency | starrocks_be_consistency_mem_bytes | 定期一致性校验使用的内存。 | consistency_max_memory_limit_percent, consistency_max_memory_limit |
| schema_change | starrocks_be_schema_change_mem_bytes | Schema Change 任务使用的总内存。 | memory_limitation_per_thread_for_schema_change |
| clone | starrocks_be_clone_mem_bytes | Tablet Clone 任务使用的总内存。 | |
| update | starrocks_be_update_mem_bytes | 主键表使用的总内存。 |
内存相关配置项
BE 配置项
| 名称 | 默认值 | 说明 |
|---|---|---|
| mem_limit | 90% | BE 进程内存上限。可设为比例上限(如 "80%")或物理上限(如 "100G")。默认硬上限为 BE 所在机器内存的 90%,软上限为 BE 所在机器内存的 80%。如果 BE 为独立部署,则无需配置,如果 BE 与其它占用内存较多的服务混合部署,则需要合理配置。 |
| load_process_max_memory_limit_bytes | 107374182400 | 单节点上所有的导入线程占据的内存上限,取 mem_limit * load_process_max_memory_limit_percent / 100 和 load_process_max_memory_limit_bytes 中较小的值。如导入内存到达限制,��则会触发刷盘和反压逻辑。 |
| load_process_max_memory_limit_percent | 30 | 单节点上所有的导入线程占据的内存上限比例,取 mem_limit * load_process_max_memory_limit_percent / 100 和 load_process_max_memory_limit_bytes 中较小的值,导入内存到达限制,会触发刷盘和反压逻辑。 |
| compaction_max_memory_limit | -1 | 所有 Compaction 线程的最大内存使用量,取 mem_limit * compaction_max_memory_limit_percent/100 和 compaction_max_memory_limit 中较小的值,-1 表示没有限制。当前不建议修改默认配置。Compaction 内存到达限制,会导致 Compaction 任务失败。 |
| compaction_max_memory_limit_percent | 100 | 所有 Compaction 线程的最大内存使用百分比,取 mem_limit * compaction_max_memory_limit_percent / 100 和 compaction_max_memory_limit 中较小的值,-1 表示没有限制。当前不建议修改默认配置。Compaction 内存到达限制,会导致 Compaction 任务失败。 |
| disable_storage_page_cache | false | 是否开启 PageCache。开启 PageCache 后,StarRocks 会缓存最近扫描过的数据,对于查询重复性高的场景,会大幅提升查询效率。true 表示不开启。该配置项与 storage_page_cache_limit 配合使用,在内存资源充足和有大数据量 Scan 的场景中启用能够加速查询性能。自 2.4 版本起,该参数默认值由 TRUE 变更为 FALSE。 自 3.1 版本开始,该参数由静态变为动态。 |
| storage_page_cache_limit | 20% | BE 存储层 page 缓存可以使用的内存上限。 |
| chunk_reserved_bytes_limit | 2147483648 | 用于加速小块内存分配的 Cache,默认上限为 2GB。您可以在内存资源充足的情况下打开。 |
| consistency_max_memory_limit_percent | 20 | 一致性校验任务使用的内存上限��,取 mem_limit * consistency_max_memory_limit_percent / 100 和 consistency_max_memory_limit 中较小的值。内存使用超限,会导致一致性校验任务失败。 |
| consistency_max_memory_limit | 10G | 一致性校验任务使用的内存上限,取 mem_limit * consistency_max_memory_limit_percent / 100 和 consistency_max_memory_limit 中较小的值。内存使用超限,会导致一致性校验任务失败。 |
| memory_limitation_per_thread_for_schema_change | 2 | 单个 Schema Change 任务的内存使用上限,内存使用超限,会导致 Schema Change 任务失败。 |
| max_compaction_concurrency | -1 | Compaction 线程数上限(即 BaseCompaction + CumulativeCompaction 的最大并发)。该参数防止 Compaction 占用过多内存。 -1 代表没有限制。0 表示不允许 compaction。开启 Event-based Compaction Framework 时,该参数才支持动态设置。 |
Session 变量
| 名称 | 默认值 | 说明 |
|---|---|---|
| query_mem_limit | 0 | 各 BE 节点上单个查询的内存限制,单位是 Byte。建议设置为 17179869184(16GB)以上。 |
| load_mem_limit | 0 | 各 BE 节点上单个导入任务的内存限制,单位是 Byte。如果设置为 0,StarRocks 采用 exec_mem_limit 作为内存限制。 |
