Deploy StarRocks with Docker
このチュートリアルでは以下をカバーします:
- 単一の Docker コンテナでの StarRocks の実行
- 基本的なデータ変換を含む 2 つの公開データセットのロード
- SELECT と JOIN を使用したデータの分析
- 基本的なデータ変換(ETL の T)
使用するデータは、NYC OpenData と National Centers for Environmental Information によって提供されています。
これらのデータセットは非常に大きいため、このチュートリアルは StarRocks を使った作業に慣れることを目的としているため、過去 120 年分のデータをロードすることはありません。Docker に 4 GB の RAM を割り当てたマシンで Docker イメージを実行し、このデータをロードできます。より大規模でフォールトトレラントなスケーラブルなデプロイメントについては、他のドキュメントを用意しており、後で提供します。
このドキュメントには多くの情報が含まれており、ステップバイステップの内容が最初に、技術的な詳細が最後に提示されています。これは以下の目的を順に果たすためです:
- 読者が StarRocks にデータをロードし、そのデータを分析できるようにする。
- ロード中のデータ変換の基本を説明する。
前提条件
Docker
- Docker
- Docker に割り当てられた 4 GB の RAM
- Docker に割り当てられた 10 GB の空きディスクスペース
SQL クライアント
Docker 環境で提供される SQL クライアントを使用するか、システム上のものを使用できます。多くの MySQL 互換クライアントが動作し、このガイドでは DBeaver と MySQL WorkBench の設定をカバーしています。
curl
curl は StarRocks へのデータロードジョブの発行とデータセットのダウンロードに使用されます。OS のプロンプトで curl または curl.exe を実行してインストールされているか確認してください。curl がインストールされていない場合は、こちらから取得してください.
用語
FE
フロントエンドノードは、メタデータ管理、クライアント接続管理、クエリプランニング、クエリスケジューリングを担当します。各 FE はメモリ内にメタデータの完全なコピーを保存・維持しており、FEs 間での無差別なサービスを保証します。
BE
バックエンドノードは、データストレージとクエリプランの実行の両方を担当します。
StarRocks の起動
docker run -p 9030:9030 -p 8030:8030 -p 8040:8040 -itd \
--name quickstart starrocks/allin1-ubuntu
SQL クライアント
These three clients are tested with this tutorial, you only need one:
- mysql CLI: You can run this from the Docker environment or your machine.
- DBeaver is available as a community version and a Pro version.
- MySQL Workbench
Configuring the client
- mysql CLI
- DBeaver
- MySQL Workbench
The easiest way to use the mysql CLI is to run it from the StarRocks container starrocks-fe:
docker exec -it quickstart \
mysql -P 9030 -h 127.0.0.1 -u root --prompt="StarRocks > "
If you would like to install the mysql CLI expand mysql client install below:
mysql client install
- macOS: If you use Homebrew and do not need MySQL Server run
brew install mysqlto install the CLI. - Linux: Check your repository system for the
mysqlclient. For example,yum install mariadb. - Microsoft Windows: Install the MySQL Community Server and run the provided client, or run
mysqlfrom WSL.
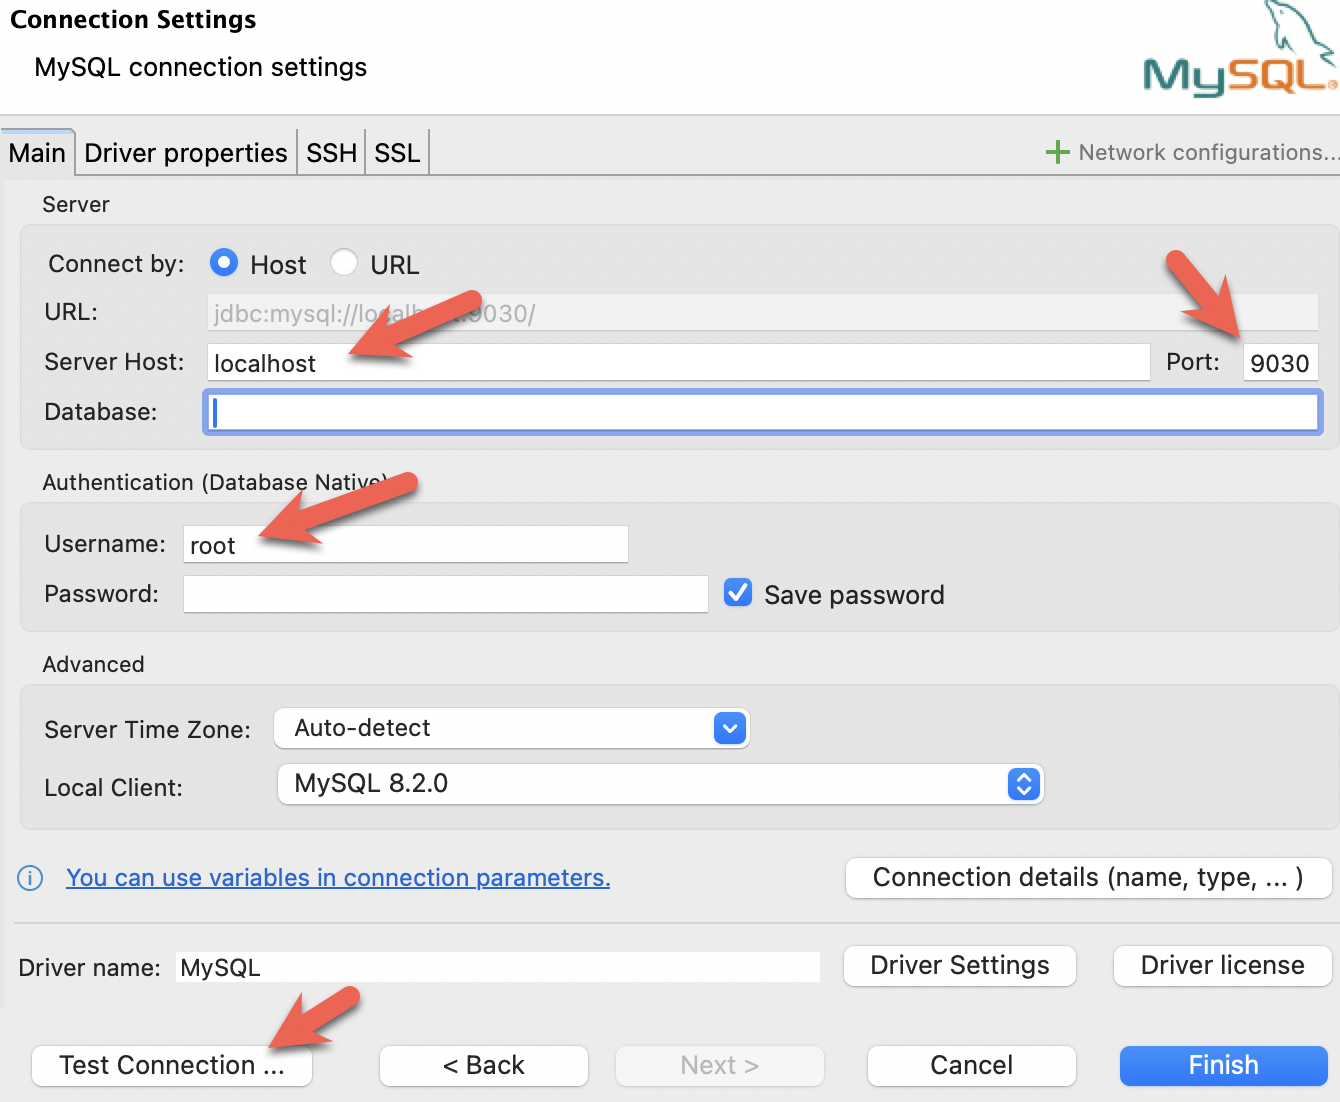
- Install DBeaver, and add a connection:
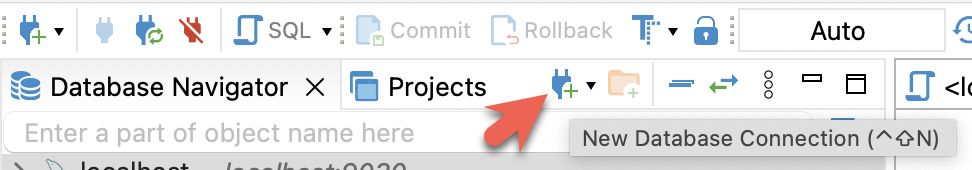
- Configure the port, IP, and username. Test the connection, and click Finish if the test succeeds:
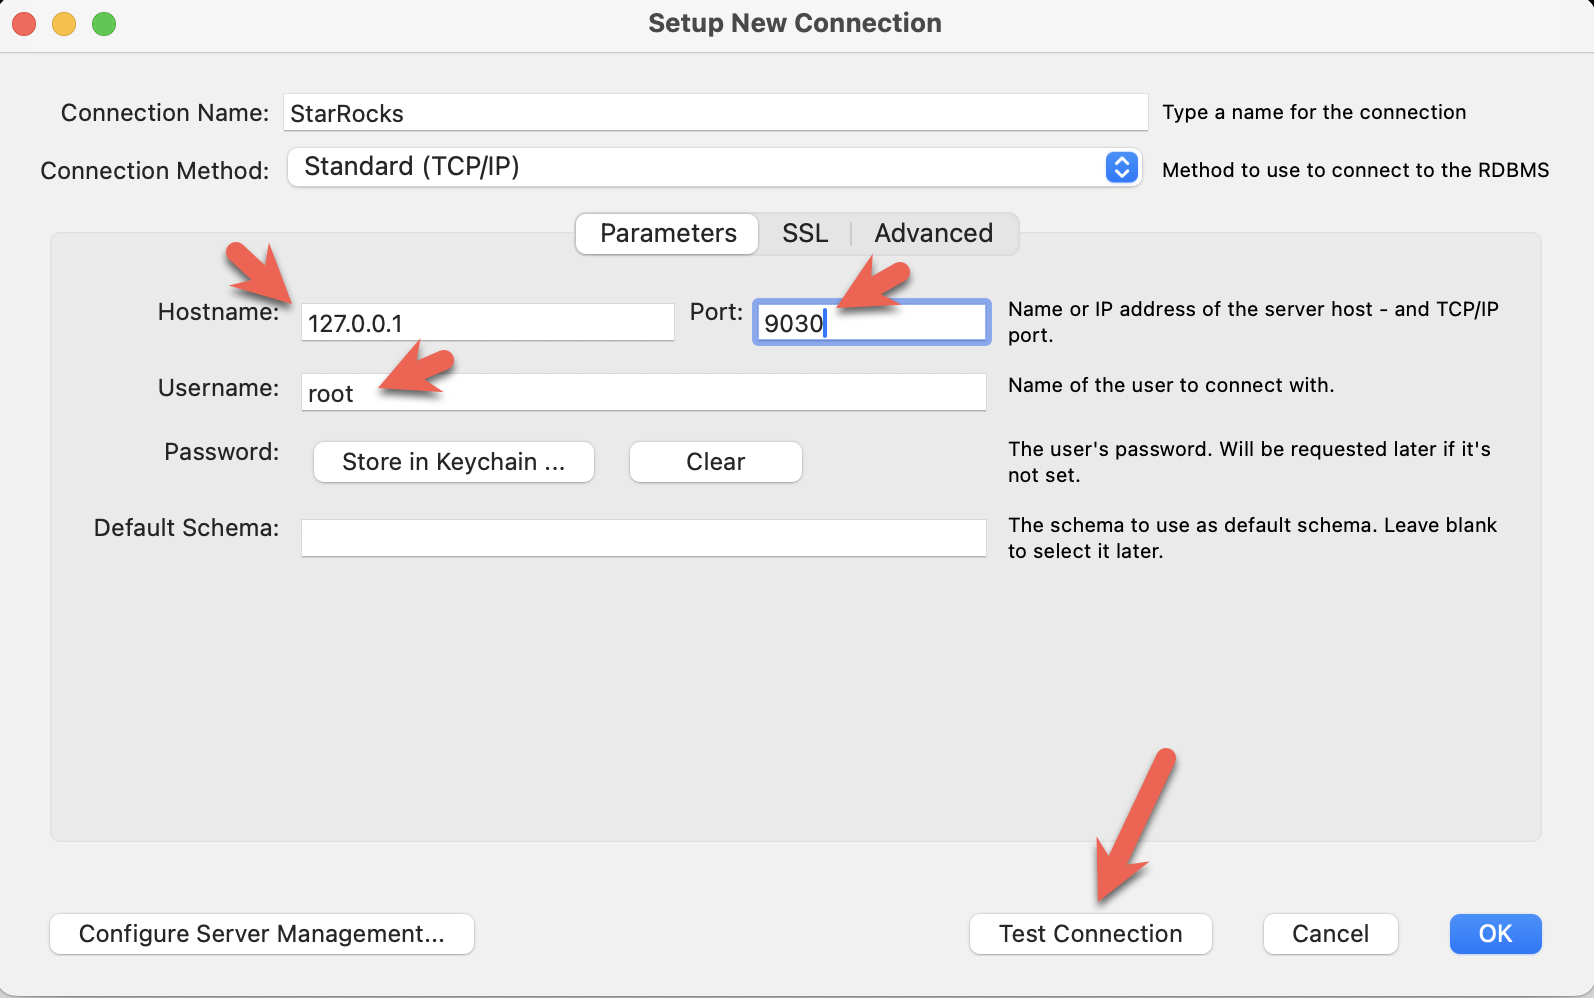
- Install the MySQL Workbench, and add a connection.
- Configure the port, IP, and username and then test the connection:
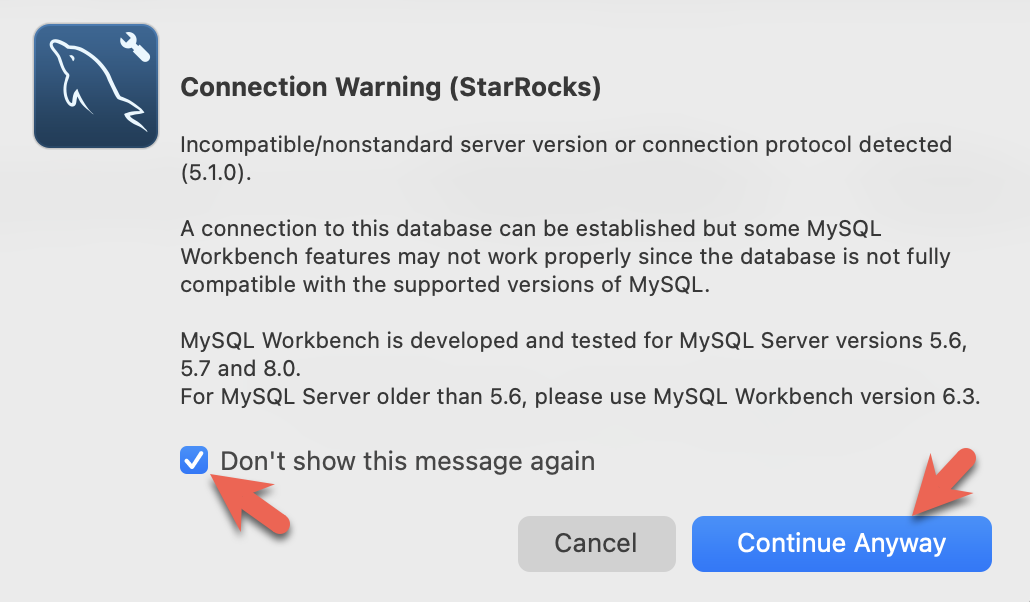
- You will see warnings from the Workbench as it is checking for a specific MySQL version. You can ignore the warnings and when prompted, you can configure Workbench to stop displaying the warnings:
データのダウンロード
これらの 2 つのデータセットをマシンにダウンロードします。Docker を実行しているホストマシンにダウンロードできます。コンテナ内にダウンロードする必要はありません。
ニューヨーク市のクラッシュデータ
curl -O https://raw.githubusercontent.com/StarRocks/demo/master/documentation-samples/quickstart/datasets/NYPD_Crash_Data.csv
気象データ
curl -O https://raw.githubusercontent.com/StarRocks/demo/master/documentation-samples/quickstart/datasets/72505394728.csv
SQL クライアントで StarRocks に接続する
mysql CLI 以外のクライアントを使用している場合は、今すぐ開いてください。
このコマンドは Docker コンテナ内で mysql コマンドを実行します:
docker exec -it quickstart \
mysql -P 9030 -h 127.0.0.1 -u root --prompt="StarRocks > "
テーブルの作成
Create a database
Type these two lines in at the StarRocks > prompt and press enter after each:
CREATE DATABASE IF NOT EXISTS quickstart;

USE quickstart;
Create two tables
Crashdata
The crash dataset contains many more fields than these, the schema has been trimmed down to include only the fields that might be useful to answer questions about the impact weather has on driving conditions.
CREATE TABLE IF NOT EXISTS crashdata (
    CRASH_DATE DATETIME,
    BOROUGH STRING,
    ZIP_CODE STRING,
    LATITUDE INT,
    LONGITUDE INT,
    LOCATION STRING,
    ON_STREET_NAME STRING,
    CROSS_STREET_NAME STRING,
    OFF_STREET_NAME STRING,
    CONTRIBUTING_FACTOR_VEHICLE_1 STRING,
    CONTRIBUTING_FACTOR_VEHICLE_2 STRING,
    COLLISION_ID INT,
    VEHICLE_TYPE_CODE_1 STRING,
    VEHICLE_TYPE_CODE_2 STRING
);
Weatherdata
Similar to the crash data, the weather dataset has many more columns (a total of 125 columns) and only the ones that are expected to answer the questions are included in the database.
CREATE TABLE IF NOT EXISTS weatherdata (
    DATE DATETIME,
    NAME STRING,
    HourlyDewPointTemperature STRING,
    HourlyDryBulbTemperature STRING,
    HourlyPrecipitation STRING,
    HourlyPresentWeatherType STRING,
    HourlyPressureChange STRING,
    HourlyPressureTendency STRING,
    HourlyRelativeHumidity STRING,
    HourlySkyConditions STRING,
    HourlyVisibility STRING,
    HourlyWetBulbTemperature STRING,
    HourlyWindDirection STRING,
    HourlyWindGustSpeed STRING,
    HourlyWindSpeed STRING
);
2 つのデータセットをロードする
StarRocks にデータをロードする方法は多数あります。このチュートリアルでは、最も簡単な方法として curl と StarRocks Stream Load を使用します。
これらの curl コマンドはオペレーティングシステムのプロンプトで実行されるため、新しいシェル��を開いてください。コマンドはダウンロードしたデータセットを参照するので、ファイルをダウンロードしたディレクトリから実行してください。
パスワードを求められます。MySQL の root ユーザーにパスワードを割り当てていない場合は、Enter キーを押してください。
curl コマンドは複雑に見えますが、チュートリアルの最後で詳細に説明されています。今はコマンドを実行してデータを分析するための SQL を実行し、データロードの詳細については最後に読んでください。
ニューヨーク市の衝突データ - クラッシュ
curl --location-trusted -u root             \
    -T ./NYPD_Crash_Data.csv                \
    -H "label:crashdata-0"                  \
    -H "column_separator:,"                 \
    -H "skip_header:1"                      \
    -H "enclose:\""                         \
    -H "max_filter_ratio:1"                 \
    -H "columns:tmp_CRASH_DATE, tmp_CRASH_TIME, CRASH_DATE=str_to_date(concat_ws(' ', tmp_CRASH_DATE, tmp_CRASH_TIME), '%m/%d/%Y %H:%i'),BOROUGH,ZIP_CODE,LATITUDE,LONGITUDE,LOCATION,ON_STREET_NAME,CROSS_STREET_NAME,OFF_STREET_NAME,NUMBER_OF_PERSONS_INJURED,NUMBER_OF_PERSONS_KILLED,NUMBER_OF_PEDESTRIANS_INJURED,NUMBER_OF_PEDESTRIANS_KILLED,NUMBER_OF_CYCLIST_INJURED,NUMBER_OF_CYCLIST_KILLED,NUMBER_OF_MOTORIST_INJURED,NUMBER_OF_MOTORIST_KILLED,CONTRIBUTING_FACTOR_VEHICLE_1,CONTRIBUTING_FACTOR_VEHICLE_2,CONTRIBUTING_FACTOR_VEHICLE_3,CONTRIBUTING_FACTOR_VEHICLE_4,CONTRIBUTING_FACTOR_VEHICLE_5,COLLISION_ID,VEHICLE_TYPE_CODE_1,VEHICLE_TYPE_CODE_2,VEHICLE_TYPE_CODE_3,VEHICLE_TYPE_CODE_4,VEHICLE_TYPE_CODE_5" \
    -XPUT http://localhost:8030/api/quickstart/crashdata/_stream_load
上記のコマンドの出力です。最初のハイライトされたセクションは、期待される出力(OK と 1 行を除くすべての行が挿入されたこと)を示しています。1 行は列数が正しくないためフィルタリングされました。
Enter host password for user 'root':
{
    "TxnId": 2,
    "Label": "crashdata-0",
    "Status": "Success",
    "Message": "OK",
    "NumberTotalRows": 423726,
    "NumberLoadedRows": 423725,
    "NumberFilteredRows": 1,
    "NumberUnselectedRows": 0,
    "LoadBytes": 96227746,
    "LoadTimeMs": 1013,
    "BeginTxnTimeMs": 21,
    "StreamLoadPlanTimeMs": 63,
    "ReadDataTimeMs": 563,
    "WriteDataTimeMs": 870,
    "CommitAndPublishTimeMs": 57,
    "ErrorURL": "http://127.0.0.1:8040/api/_load_error_log?file=error_log_da41dd88276a7bfc_739087c94262ae9f"
}%
エラーが発生した場合、出力にはエラーメッセージを確認するための URL が提供されます。これをブラウザで開いて、何が起こったかを確認してください。詳細を展開してエラーメッセージを確認します:
ブラウザ�でのエラーメッセージの読み取り
Error: Value count does not match column count. Expect 29, but got 32.

Column delimiter: 44,Row delimiter: 10.. Row: 09/06/2015,14:15,,,40.6722269,-74.0110059,"(40.6722269, -74.0110059)",,,"R/O 1 BEARD ST. ( IKEA'S
09/14/2015,5:30,BRONX,10473,40.814551,-73.8490955,"(40.814551, -73.8490955)",TORRY AVENUE                    ,NORTON AVENUE                   ,,0,0,0,0,0,0,0,0,Driver Inattention/Distraction,Unspecified,,,,3297457,PASSENGER VEHICLE,PASSENGER VEHICLE,,,
気象データ
クラッシュデータをロードしたのと同様に、気象データセットをロードします。
curl --location-trusted -u root             \
    -T ./72505394728.csv                    \
    -H "label:weather-0"                    \
    -H "column_separator:,"                 \
    -H "skip_header:1"                      \
    -H "enclose:\""                         \
    -H "max_filter_ratio:1"                 \
    -H "columns: STATION, DATE, LATITUDE, LONGITUDE, ELEVATION, NAME, REPORT_TYPE, SOURCE, HourlyAltimeterSetting, HourlyDewPointTemperature, HourlyDryBulbTemperature, HourlyPrecipitation, HourlyPresentWeatherType, HourlyPressureChange, HourlyPressureTendency, HourlyRelativeHumidity, HourlySkyConditions, HourlySeaLevelPressure, HourlyStationPressure, HourlyVisibility, HourlyWetBulbTemperature, HourlyWindDirection, HourlyWindGustSpeed, HourlyWindSpeed, Sunrise, Sunset, DailyAverageDewPointTemperature, DailyAverageDryBulbTemperature, DailyAverageRelativeHumidity, DailyAverageSeaLevelPressure, DailyAverageStationPressure, DailyAverageWetBulbTemperature, DailyAverageWindSpeed, DailyCoolingDegreeDays, DailyDepartureFromNormalAverageTemperature, DailyHeatingDegreeDays, DailyMaximumDryBulbTemperature, DailyMinimumDryBulbTemperature, DailyPeakWindDirection, DailyPeakWindSpeed, DailyPrecipitation, DailySnowDepth, DailySnowfall, DailySustainedWindDirection, DailySustainedWindSpeed, DailyWeather, MonthlyAverageRH, MonthlyDaysWithGT001Precip, MonthlyDaysWithGT010Precip, MonthlyDaysWithGT32Temp, MonthlyDaysWithGT90Temp, MonthlyDaysWithLT0Temp, MonthlyDaysWithLT32Temp, MonthlyDepartureFromNormalAverageTemperature, MonthlyDepartureFromNormalCoolingDegreeDays, MonthlyDepartureFromNormalHeatingDegreeDays, MonthlyDepartureFromNormalMaximumTemperature, MonthlyDepartureFromNormalMinimumTemperature, MonthlyDepartureFromNormalPrecipitation, MonthlyDewpointTemperature, MonthlyGreatestPrecip, MonthlyGreatestPrecipDate, MonthlyGreatestSnowDepth, MonthlyGreatestSnowDepthDate, MonthlyGreatestSnowfall, MonthlyGreatestSnowfallDate, MonthlyMaxSeaLevelPressureValue, MonthlyMaxSeaLevelPressureValueDate, MonthlyMaxSeaLevelPressureValueTime, MonthlyMaximumTemperature, MonthlyMeanTemperature, MonthlyMinSeaLevelPressureValue, MonthlyMinSeaLevelPressureValueDate, MonthlyMinSeaLevelPressureValueTime, MonthlyMinimumTemperature, MonthlySeaLevelPressure, MonthlyStationPressure, MonthlyTotalLiquidPrecipitation, MonthlyTotalSnowfall, MonthlyWetBulb, AWND, CDSD, CLDD, DSNW, HDSD, HTDD, NormalsCoolingDegreeDay, NormalsHeatingDegreeDay, ShortDurationEndDate005, ShortDurationEndDate010, ShortDurationEndDate015, ShortDurationEndDate020, ShortDurationEndDate030, ShortDurationEndDate045, ShortDurationEndDate060, ShortDurationEndDate080, ShortDurationEndDate100, ShortDurationEndDate120, ShortDurationEndDate150, ShortDurationEndDate180, ShortDurationPrecipitationValue005, ShortDurationPrecipitationValue010, ShortDurationPrecipitationValue015, ShortDurationPrecipitationValue020, ShortDurationPrecipitationValue030, ShortDurationPrecipitationValue045, ShortDurationPrecipitationValue060, ShortDurationPrecipitationValue080, ShortDurationPrecipitationValue100, ShortDurationPrecipitationValue120, ShortDurationPrecipitationValue150, ShortDurationPrecipitationValue180, REM, BackupDirection, BackupDistance, BackupDistanceUnit, BackupElements, BackupElevation, BackupEquipment, BackupLatitude, BackupLongitude, BackupName, WindEquipmentChangeDate" \
    -XPUT http://localhost:8030/api/quickstart/weatherdata/_stream_load
質問に答える
These queries can be run in your SQL client. All of the queries use the quickstart database.
USE quickstart;
How many crashes are there per hour in NYC?
SELECT COUNT(*),
       date_trunc("hour", crashdata.CRASH_DATE) AS Time
FROM crashdata
GROUP BY Time
ORDER BY Time ASC
LIMIT 200;
Here is part of the output. Note that I am looking closer at January 6th and 7th as this is Monday and Tuesday of a non-holiday week. Looking at New Years Day is probably not indicative of a normal morning during rush-hour traffic.
|       14 | 2014-01-06 06:00:00 |
|       16 | 2014-01-06 07:00:00 |
|       43 | 2014-01-06 08:00:00 |
|       44 | 2014-01-06 09:00:00 |
|       21 | 2014-01-06 10:00:00 |
|       28 | 2014-01-06 11:00:00 |
|       34 | 2014-01-06 12:00:00 |
|       31 | 2014-01-06 13:00:00 |
|       35 | 2014-01-06 14:00:00 |
|       36 | 2014-01-06 15:00:00 |
|       33 | 2014-01-06 16:00:00 |
|       40 | 2014-01-06 17:00:00 |
|       35 | 2014-01-06 18:00:00 |
|       23 | 2014-01-06 19:00:00 |
|       16 | 2014-01-06 20:00:00 |
|       12 | 2014-01-06 21:00:00 |
|       17 | 2014-01-06 22:00:00 |
|       14 | 2014-01-06 23:00:00 |
|       10 | 2014-01-07 00:00:00 |
|        4 | 2014-01-07 01:00:00 |
|        1 | 2014-01-07 02:00:00 |
|        3 | 2014-01-07 03:00:00 |
|        2 | 2014-01-07 04:00:00 |
|        6 | 2014-01-07 06:00:00 |
|       16 | 2014-01-07 07:00:00 |
|       41 | 2014-01-07 08:00:00 |
|       37 | 2014-01-07 09:00:00 |
|       33 | 2014-01-07 10:00:00 |
It looks like about 40 accidents on a Monday or Tuesday morning during rush hour traffic, and around the same at 17:00 hours.
What is the average temperature in NYC?
SELECT avg(HourlyDryBulbTemperature),
       date_trunc("hour", weatherdata.DATE) AS Time
FROM weatherdata
GROUP BY Time
ORDER BY Time ASC
LIMIT 100;
Output:
Note that this is data from 2014, NYC has not been this cold lately.
+-------------------------------+---------------------+
| avg(HourlyDryBulbTemperature) | Time                |
+-------------------------------+---------------------+
|                            25 | 2014-01-01 00:00:00 |
|                            25 | 2014-01-01 01:00:00 |
|                            24 | 2014-01-01 02:00:00 |
|                            24 | 2014-01-01 03:00:00 |
|                            24 | 2014-01-01 04:00:00 |
|                            24 | 2014-01-01 05:00:00 |
|                            25 | 2014-01-01 06:00:00 |
|                            26 | 2014-01-01 07:00:00 |
Is it safe to drive in NYC when visibility is poor?
Let's look at the number of crashes when visibility is poor (between 0 and 1.0 miles). To answer this question use a JOIN across the two tables on the DATETIME column.
SELECT COUNT(DISTINCT c.COLLISION_ID) AS Crashes,
       truncate(avg(w.HourlyDryBulbTemperature), 1) AS Temp_F,
       truncate(avg(w.HourlyVisibility), 2) AS Visibility,
       max(w.HourlyPrecipitation) AS Precipitation,
       date_format((date_trunc("hour", c.CRASH_DATE)), '%d %b %Y %H:%i') AS Hour
FROM crashdata c
LEFT JOIN weatherdata w
ON date_trunc("hour", c.CRASH_DATE)=date_trunc("hour", w.DATE)
WHERE w.HourlyVisibility BETWEEN 0.0 AND 1.0
GROUP BY Hour
ORDER BY Crashes DESC
LIMIT 100;
The highest number of crashes in a single hour during low visibility is 129. There are multiple things to consider:
- February 3rd 2014 was a Monday
- 8AM is rush hour
- It was raining (0.12 inches or precipitation that hour)
- The temperature is 32 degrees F (the freezing point for water)
- Visibility is bad at 0.25 miles, normal for NYC is 10 miles
+---------+--------+------------+---------------+-------------------+
| Crashes | Temp_F | Visibility | Precipitation | Hour              |
+---------+--------+------------+---------------+-------------------+
|     129 |     32 |       0.25 | 0.12          | 03 Feb 2014 08:00 |
|     114 |     32 |       0.25 | 0.12          | 03 Feb 2014 09:00 |
|     104 |     23 |       0.33 | 0.03          | 09 Jan 2015 08:00 |
|      96 |   26.3 |       0.33 | 0.07          | 01 Mar 2015 14:00 |
|      95 |     26 |       0.37 | 0.12          | 01 Mar 2015 15:00 |
|      93 |     35 |       0.75 | 0.09          | 18 Jan 2015 09:00 |
|      92 |     31 |       0.25 | 0.12          | 03 Feb 2014 10:00 |
|      87 |   26.8 |        0.5 | 0.09          | 01 Mar 2015 16:00 |
|      85 |     55 |       0.75 | 0.20          | 23 Dec 2015 17:00 |
|      85 |     20 |       0.62 | 0.01          | 06 Jan 2015 11:00 |
|      83 |   19.6 |       0.41 | 0.04          | 05 Mar 2015 13:00 |
|      80 |     20 |       0.37 | 0.02          | 06 Jan 2015 10:00 |
|      76 |   26.5 |       0.25 | 0.06          | 05 Mar 2015 09:00 |
|      71 |     26 |       0.25 | 0.09          | 05 Mar 2015 10:00 |
|      71 |   24.2 |       0.25 | 0.04          | 05 Mar 2015 11:00 |
What about driving in icy conditions?
Water vapor can desublimate to ice at 40 degrees F; this query looks at temps between 0 and 40 degrees F.
SELECT COUNT(DISTINCT c.COLLISION_ID) AS Crashes,
       truncate(avg(w.HourlyDryBulbTemperature), 1) AS Temp_F,
       truncate(avg(w.HourlyVisibility), 2) AS Visibility,
       max(w.HourlyPrecipitation) AS Precipitation,
       date_format((date_trunc("hour", c.CRASH_DATE)), '%d %b %Y %H:%i') AS Hour
FROM crashdata c
LEFT JOIN weatherdata w
ON date_trunc("hour", c.CRASH_DATE)=date_trunc("hour", w.DATE)
WHERE w.HourlyDryBulbTemperature BETWEEN 0.0 AND 40.5
GROUP BY Hour
ORDER BY Crashes DESC
LIMIT 100;
The results for freezing temperatures suprised me a little, I did not expect too much traffic on a Sunday morning in the city on a cold January day.A quick look at weather.com showed that there was a big storm with many crashes that day, just like what can be seen in the data.
+---------+--------+------------+---------------+-------------------+
| Crashes | Temp_F | Visibility | Precipitation | Hour              |
+---------+--------+------------+---------------+-------------------+
|     192 |     34 |        1.5 | 0.09          | 18 Jan 2015 08:00 |
|     170 |     21 |       NULL |               | 21 Jan 2014 10:00 |
|     145 |     19 |       NULL |               | 21 Jan 2014 11:00 |
|     138 |   33.5 |          5 | 0.02          | 18 Jan 2015 07:00 |
|     137 |     21 |       NULL |               | 21 Jan 2014 09:00 |
|     129 |     32 |       0.25 | 0.12          | 03 Feb 2014 08:00 |
|     114 |     32 |       0.25 | 0.12          | 03 Feb 2014 09:00 |
|     104 |     23 |        0.7 | 0.04          | 09 Jan 2015 08:00 |
|      98 |     16 |          8 | 0.00          | 06 Mar 2015 08:00 |
|      96 |   26.3 |       0.33 | 0.07          | 01 Mar 2015 14:00 |
Drive carefully!
まとめ
このチュートリアルでは以下を行いました:
- Docker で StarRocks をデプロイ
- ニューヨーク市が提供するクラッシュデータと NOAA が提供する気象データをロード
- SQL JOIN を使用して、視界が悪い状態や凍結した道路での運転が悪い考えであることを分析
学ぶことはまだあります。Stream Load 中に行われたデータ変換については意図的に詳しく触れませんでした。curl コマンドに関する詳細は以下のノートに記載されています。
curl コマンドに関するノート
StarRocks Stream Load and curl take many arguments. Only the ones used in this tutorial are described here, the rest will be linked to in the more information section.
--location-trusted
This configures curl to pass credentials to any redirected URLs.
-u root
The username used to log in to StarRocks
-T filename
T is for transfer, the filename to transfer.
label:name-num
The label to associate with this Stream Load job. The label must be unique, so if you run the job multiple times you can add a number and keep incrementing that.
column_separator:,
If you load a file that uses a single , then set it as shown above, if you use a different delimiter then set that delimiter here. Common choices are \t, ,, and |.
skip_header:1
Some CSV files have a single header row with all of the column names listed, and some add a second line with datatypes. Set skip_header to 1 or 2 if you have one or two header lines, and set it to 0 if you have none.
enclose:\"
It is common to enclose strings that contain embedded commas with double-quotes. The sample datasets used in this tutorial have geo locations that contain commas and so the enclose setting is set to \". Remember to escape the " with a \.
max_filter_ratio:1
This allows some errors in the data. Ideally this would be set to 0 and the job would fail with any errors. It is set to 1 to allow all rows to fail during debugging.
columns:
The mapping of CSV file columns to StarRocks table columns. You will notice that there are many more columns in the CSV files than columns in the table. Any columns that are not included in the table are skipped.
You will also notice that there is some transformation of data included in the columns: line for the crash dataset. It is very common to find dates and times in CSV files that do not conform to standards. This is the logic for converting the CSV data for the time and date of the crash to a DATETIME type:
The columns line
This is the beginning of one data record. The date is in MM/DD/YYYY format, and the time is HH:MI. Since DATETIME is generally YYYY-MM-DD HH:MI:SS we need to transform this data.
08/05/2014,9:10,BRONX,10469,40.8733019,-73.8536375,"(40.8733019, -73.8536375)",
This is the beginning of the columns: parameter:
-H "columns:tmp_CRASH_DATE, tmp_CRASH_TIME, CRASH_DATE=str_to_date(concat_ws(' ', tmp_CRASH_DATE, tmp_CRASH_TIME), '%m/%d/%Y %H:%i')
This instructs StarRocks to:
- Assign the content of the first column of the CSV file to
tmp_CRASH_DATE - Assign the content of the second column of the CSV file to
tmp_CRASH_TIME concat_ws()concatenatestmp_CRASH_DATEandtmp_CRASH_TIMEtogether with a space between themstr_to_date()creates a DATETIME from the concatenated string- store the resulting DATETIME in the column
CRASH_DATE
さらなる情報
Motor Vehicle Collisions - Crashes データセットは、ニューヨーク市によって提供されており、これらの 利用規約 と プライバシーポリシー に従います。
Local Climatological Data(LCD) は NOAA によって提供されており、この 免責事項 とこの プライバシー�ポリシー に従います。
