Query Profile Structure and Metrics
Structure of Query Profile
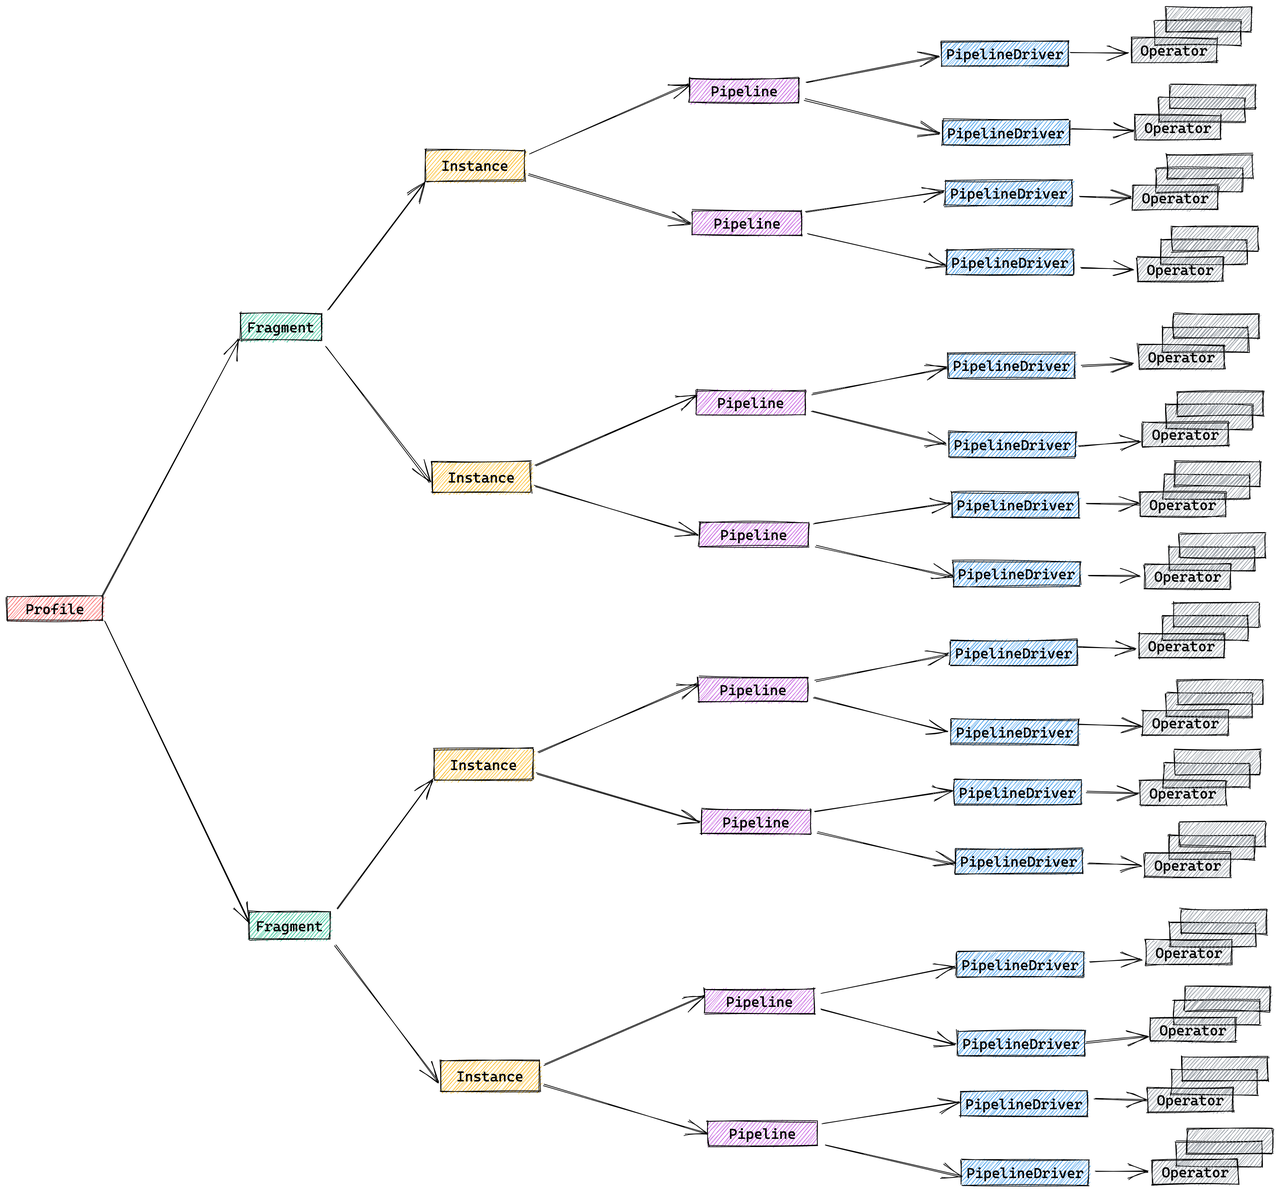
The structure of a Query Profile is closely related to the design of StarRocks' execution engine and consists of the following five parts:
- Fragment: Execution tree. A query is composed of one or more fragments.
- FragmentInstance: Each fragment can have multiple instances, each instance is called a FragmentInstance, and is executed by different computing nodes.
- Pipeline: A FragmentInstance is split into multiple pipelines. A pipeline is an execution chain consisting of a group of connected Operator instances.
- PipelineDriver: A Pipeline can have multiple instances, each instance is called a PipelineDriver, to fully utilize multiple computing cores.
- Operator: A PipelineDriver consists of multiple Operator instances.
Query Profile Merging Strategy
By analyzing the structure of Query Profile, you can easily observe that multiple FragmentInstances associated with the same Fragment have a high degree of similarity in structure. Similarly, multiple PipelineDrivers belonging to the same Pipeline also exhibit similar structural features. To reduce the volume of the Query Profile, StarRocks by default merges the FragmentInstance layer and the PipelineDriver layer. As a result, the original five-layer structure is simplified to three layers:
- Fragment
- Pipeline
- Operator
You can control this merging behavior through a session variable pipeline_profile_level, which has two valid values:
1(Default): StarRocks merges the metrics into a three-layer structure.2: StarRocks does not merge the metrics. The original five-layer structure is retained.- Any other value will be treated as the default value
1.
Generally, we do not recommend setting this parameter to 2 because the Query Profile with the five-layer structure has many limitations. For example, you cannot perform visualized analysis on the profile using any tools. Therefore, unless the merging process leads to the loss of crucial information, you do not need to adjust this parameter.
Metric Merging and MIN/MAX Values
When merging FragmentInstance and PipelineDriver, all metrics with the same name are merged. Only the minimum and maximum values of each metric in all concurrent instances are recorded. Different types of metrics use different merging strategies:
- Time-related metrics take the average. For example:
OperatorTotalTimeis the average time consumption of all concurrent instances.__MAX_OF_OperatorTotalTimeis the maximum time consumption among all concurrent instances.__MIN_OF_OperatorTotalTimeis the minimum time consumption among all concurrent instances.
             - OperatorTotalTime: 2.192us
               - __MAX_OF_OperatorTotalTime: 2.502us
               - __MIN_OF_OperatorTotalTime: 1.882us
- Non-time-related metrics are summed. For example:
PullChunkNumis the sum of this metric in all concurrent instances.__MAX_OF_PullChunkNumis the maximum value of this metric among all concurrent instances.__MIN_OF_PullChunkNumis the minimum value of this metric among all concurrent instances.
             - PullChunkNum: 146.66K (146660)
               - __MAX_OF_PullChunkNum: 24.45K (24450)
               - __MIN_OF_PullChunkNum: 24.435K (24435)
- Some metrics without extreme values have the same value in all concurrent instances, for example:
DegreeOfParallelism.
Usually, if there is a significant difference between MIN and MAX values, it indicates a high probability of data skew. Possible scenarios include aggregation and join operations.
             - OperatorTotalTime: 2m48s
               - __MAX_OF_OperatorTotalTime: 10m30s
               - __MIN_OF_OperatorTotalTime: 279.170us
Query Profile Metrics List
The Query Profile includes a multitude of metrics providing detailed information about query execution. In most cases, you only need to focus on the execution time of operators and the size of processed data. Once you identify bottlenecks, you can address them specifically.
Summary Metrics
Total
Description: The total time consumed by the query, including Planning, Executing, and Profiling phase durations.
Query State
Description: Query state, possible states include Finished, Error, and Running.
Execution Overview Metrics
FrontendProfileMergeTime
Description: Query Profile processing time on the Frontend (FE) side.
QueryAllocatedMemoryUsage
Description: Cumulative allocated memory across all compute nodes.
QueryDeallocatedMemoryUsage
Description: Cumulative deallocated memory across all compute nodes.
QueryPeakMemoryUsage
Description: Maximum peak memory across all compute nodes.
QueryExecutionWallTime
Description: Wall time of the execution.
QueryCumulativeCpuTime
Description: Cumulative CPU time across all compute nodes.
QueryCumulativeOperatorTime
Description: Cumulative time across all nodes. This is a simple linear accumulation, but in reality, execution times of different operators may overlap. This parameter serves as the denominator for calculating the percentage of time spent on each operator.
QueryCumulativeNetworkTime
Description: Cumulative network time of all Exchange nodes. Similar to cumulative operator time, actual execution times of different Exchanges may overlap.
QueryCumulativeScanTime
Description: Cumulative IO time of all Scan nodes. Similar to cumulative operator time, actual execution times of different Scan operations may overlap.
QueryPeakScheduleTime
Description: Maximum ScheduleTime metric across all Pipelines.
QuerySpillBytes
Description: Size of data spilled to local disks.
ResultDeliverTime
Description: Additional time to transfer results. For query statements, this parameter refers to the time it takes to send data back to the client; for insert statements, it refers to the time it takes to write data to the storage layer.
Fragment Metrics
InstanceNum
Description: Number of all FragmentInstances for this Fragment.
InstanceIds
Description: IDs of all FragmentInstances for this Fragment.
BackendNum
Description: Number of BEs participating in the execution of this Fragment.
BackendAddresses
Description: Addresses of all BEs participating in the execution of this Fragment.
FragmentInstancePrepareTime
Description: Time spent in the Fragment Prepare phase.
InstanceAllocatedMemoryUsage
Description: Cumulative allocated memory for all FragmentInstances under this Fragment.
InstanceDeallocatedMemoryUsage
Description: Cumulative deallocated memory for all FragmentInstances under this Fragment.
InstancePeakMemoryUsage
Description: The peak memory usage across all FragmentInstances under this Fragment.
Pipeline Metrics
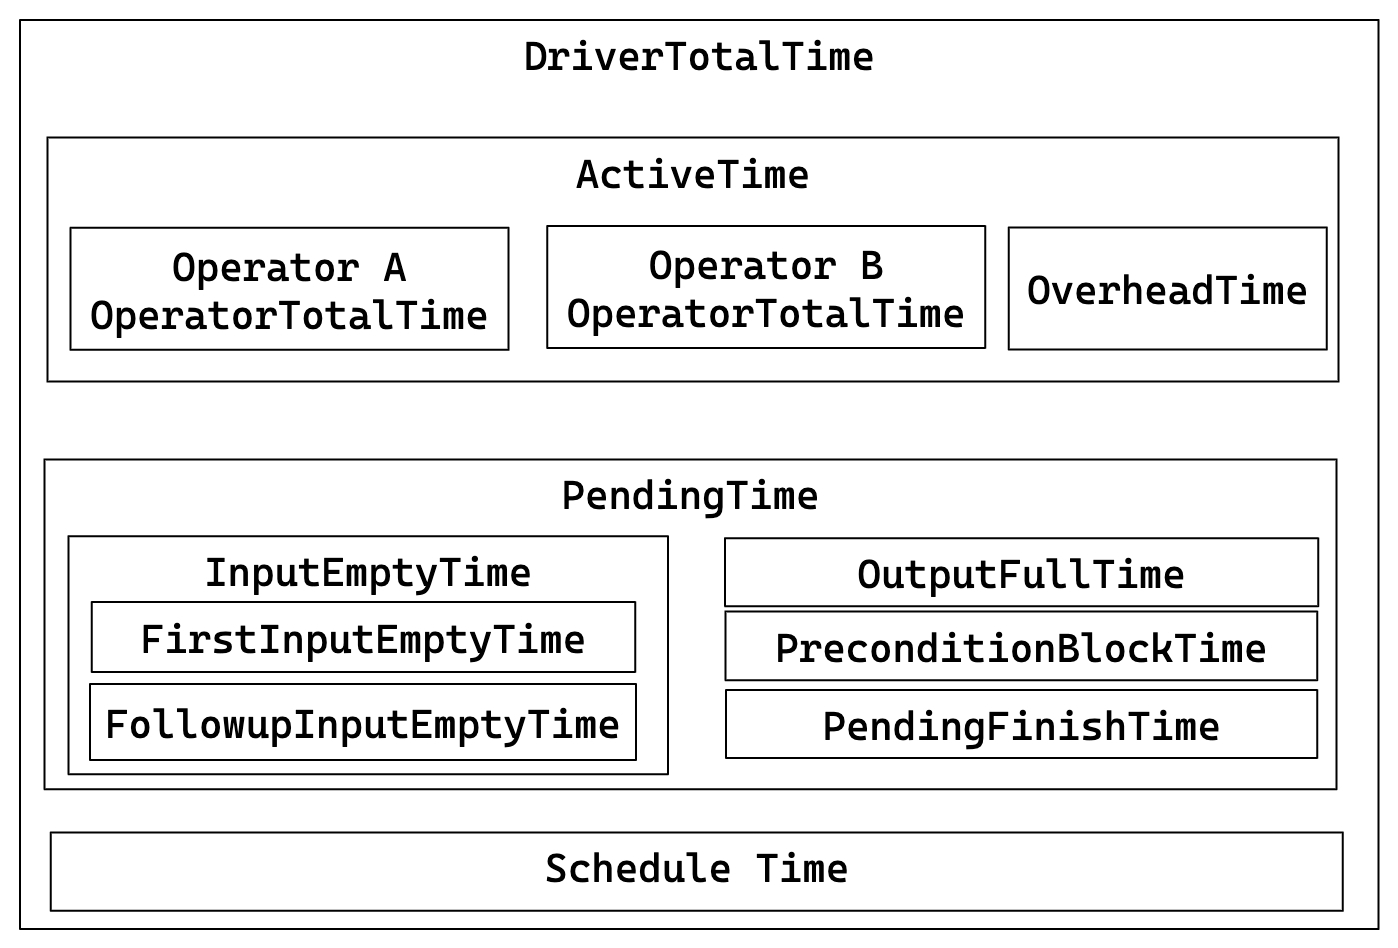
The relationship between core metrics is illustrated in the following diagram:
- DriverTotalTime = ActiveTime + PendingTime + ScheduleTime
- ActiveTime = ∑ OperatorTotalTime + OverheadTime
- PendingTime = InputEmptyTime + OutputFullTime + PreconditionBlockTime + PendingFinishTime
- InputEmptyTime = FirstInputEmptyTime + FollowupInputEmptyTime
DegreeOfParallelism
Description: Degree of pipeline execution parallelism.
TotalDegreeOfParallelism
Description: Sum of degrees of parallelism. Since the same Pipeline may execute on multiple machines, this item aggregates all values.
DriverPrepareTime
Description: Time taken by the Prepare phase. This metric is not included in DriverTotalTime.
DriverTotalTime
Description: Total execution time of the Pipeline, excluding the time spent in the Prepare phase.
ActiveTime
Description: Execution time of the Pipeline, including the execution time of each operator and the overall framework overhead, such as time spent in invoking methods like has_output, need_input, etc.
PendingTime
Description: Time the Pipeline is blocked from being scheduled for various reasons.
InputEmptyTime
Description: Time the Pipeline is blocked due to an empty input queue.
FirstInputEmptyTime
Description: Time the Pipeline is first blocked due to an empty input queue. The first blocking time is separately calculated because the first blocking is mainly caused by Pipeline dependencies.
FollowupInputEmptyTime
Description: Time the Pipeline is subsequently blocked due to an empty input queue.
OutputFullTime
Description: Time the Pipeline is blocked due to a full output queue.
PreconditionBlockTime
Description: Time the Pipeline is blocked due to unmet dependencies.
PendingFinishTime
Description: Time the Pipeline is blocked waiting for asynchronous tasks to finish.
ScheduleTime
Description: Scheduling time of the Pipeline, from entering the ready queue to being scheduled for execution.
BlockByInputEmpty
Description: Number of times the pipeline is blocked due to InputEmpty.
BlockByOutputFull
Description: Number of times the pipeline is blocked due to OutputFull.
BlockByPrecondition
Description: Number of times the pipeline is blocked due to unmet preconditions.
Operator General Metrics
PrepareTime
Description: Time spent on preparation.
OperatorTotalTime
Description: Total time consumed by the Operator. It satisfies the equation: OperatorTotalTime = PullTotalTime + PushTotalTime + SetFinishingTime + SetFinishedTime + CloseTime. It excludes time spent on preparation.
PullTotalTime
Description: Total time the Operator spends executing push_chunk.
PushTotalTime
Description: Total time the Operator spends executing pull_chunk.
SetFinishingTime
Description: Total time the Operator spends executing set_finishing.
SetFinishedTime
Description: Total time the Operator spends executing set_finished.
PushRowNum
Description: Cumulative number of input rows for the Operator.
PullRowNum
Description: Cumulative number of output rows for the Operator.
JoinRuntimeFilterEvaluate
Description: Number of times Join Runtime Filter is evaluated.
JoinRuntimeFilterHashTime
Description: Time spent computing hash for Join Runtime Filter.
JoinRuntimeFilterInputRows
Description: Number of input rows for Join Runtime Filter.
JoinRuntimeFilterOutputRows
Description: Number of output rows for Join Runtime Filter.
JoinRuntimeFilterTime
Description: Time spent on Join Runtime Filter.
Unique Metrics
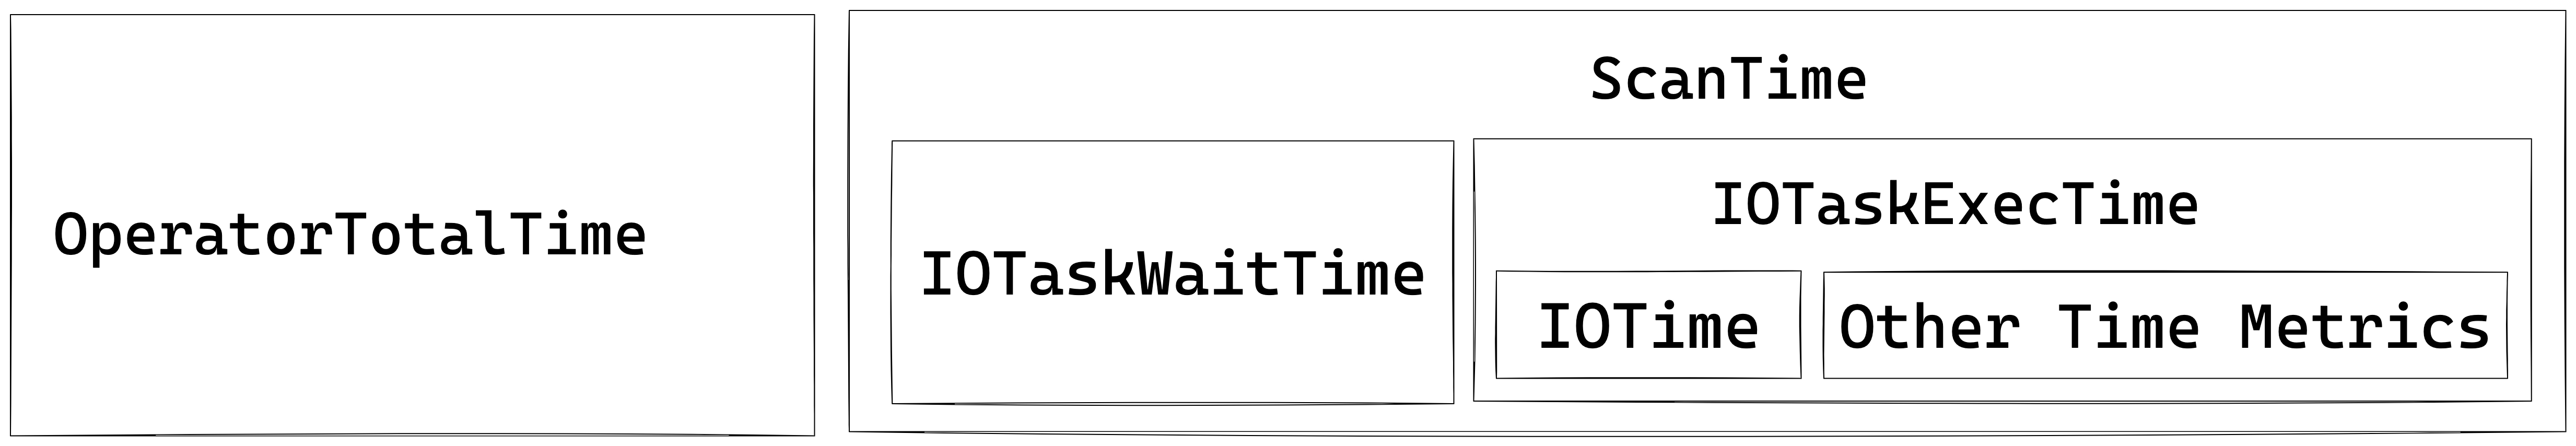
Scan Operator
The Scan Operator utilizes an additional thread pool for executing IO tasks. Therefore, the relationship between time metrics for this node is illustrated below:
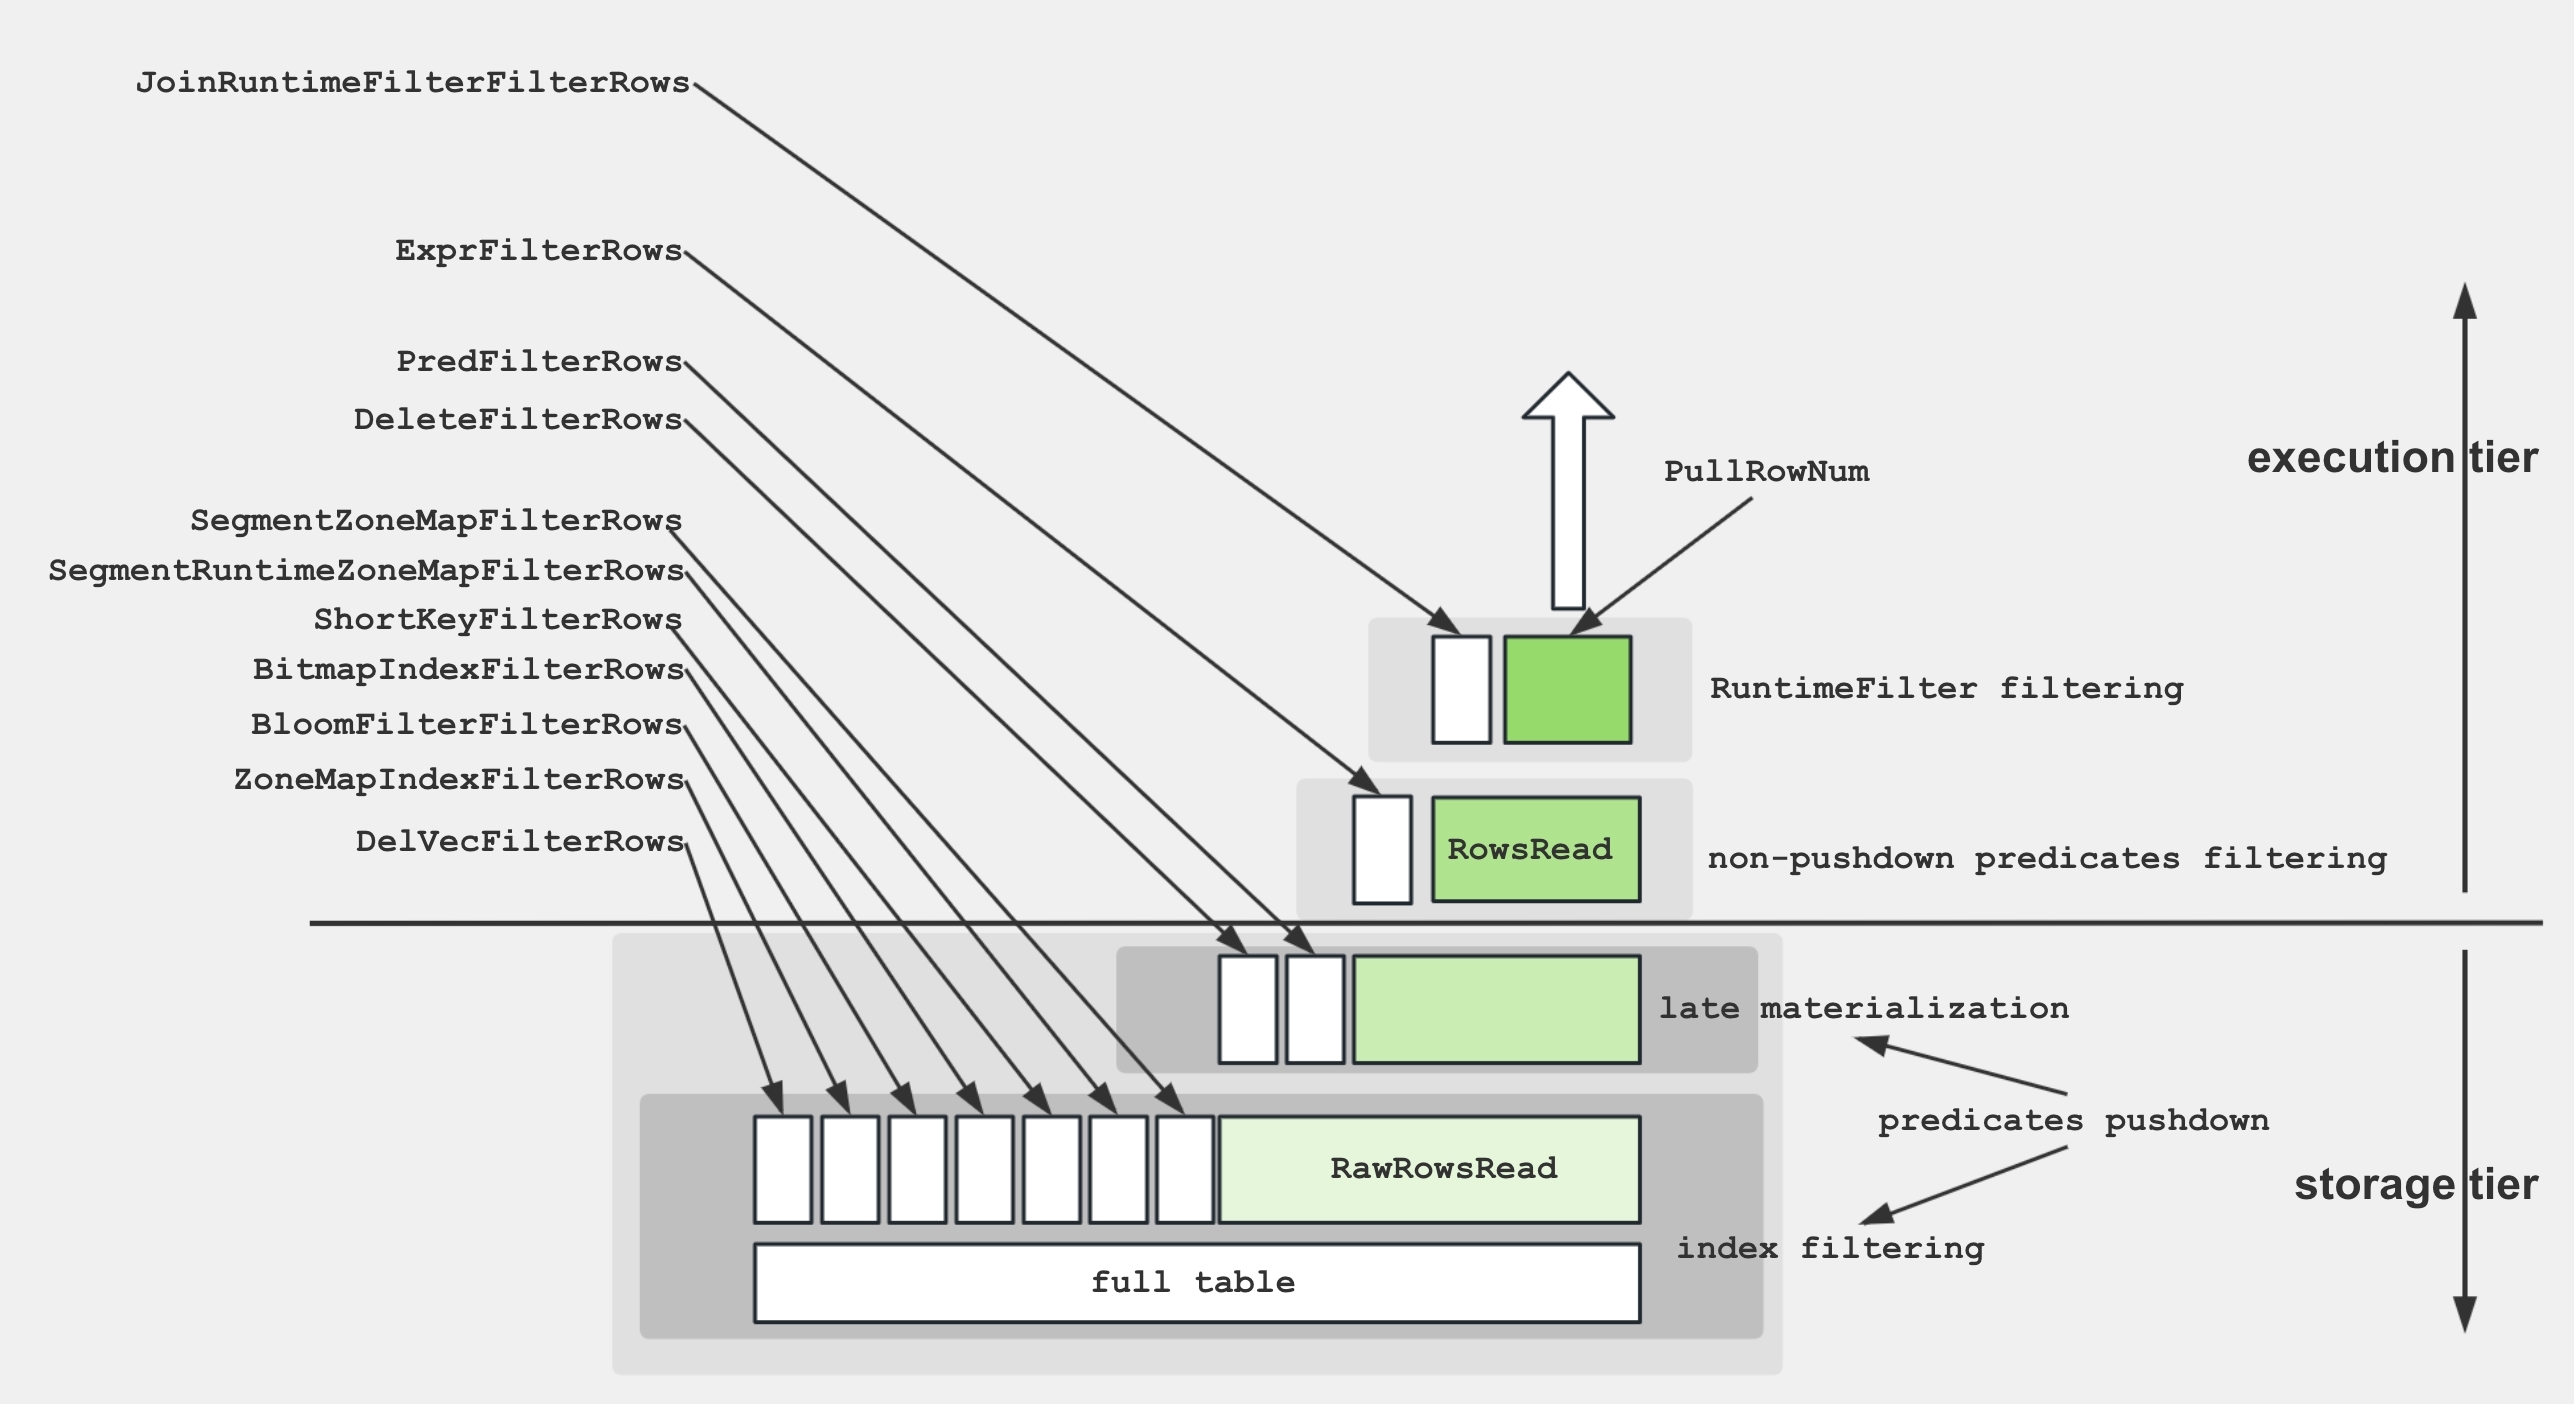
OLAP Scan Operator
To facilitate a better understanding of the various metrics within the Scan Operator, the following diagram demonstrates the associations between these metrics and storage structures.
Table
- Description: Table name.
- Level: Primary metric
Rollup
- Description: Materialized view name. If no materialized view is hit, it is equivalent to the table name.
- Level: Primary metric
SharedScan
- Description: Whether the enable_shared_scan session variable is enabled.
- Level: Primary metric
TabletCount
- Description: Number of tablets.
- Level:
Primary metric
MorselsCount
- Description: Number of morsels.
- Level: Primary metric
PushdownPredicates
- Description: Number of pushdown predicates.
- Level: Primary metric
Predicates
- Description: Predicate expressions.
- Level: Primary metric
BytesRead
- Description: Size of data read.
- Level: Primary metric
CompressedBytesRead
- Description: Size of compressed data read from disk.
- Level: Primary metric
UncompressedBytesRead
- Description: Size of uncompressed data read from disk.
- Level: Primary metric
RowsRead
- Description: Number of rows read (after predicate filtering).
- Level: Primary metric
RawRowsRead
- Description: Number of raw rows read (before predicate filtering).
- Level: Primary metric
ReadPagesNum
- Description: Number of pages read.
- Level: Primary metric
CachedPagesNum
- Description: Number of cached pages.
- Level: Primary metric
ChunkBufferCapacity
- Description: Capacity of the Chunk Buffer.
- Level: Primary metric
DefaultChunkBufferCapacity
- Description: Default capacity of the Chunk Buffer.
- Level: Primary metric
PeakChunkBufferMemoryUsage
- Description: Peak memory usage of the Chunk Buffer.
- Level: Primary metric
PeakChunkBufferSize
- Description: Peak size of the Chunk Buffer.
- Level: Primary metric
PrepareChunkSourceTime
- Description: Time spent preparing the Chunk Source.
- Level: Primary metric
ScanTime
- Description: Cumulative scan time. Scan operations are completed in an asynchronous I/O thread pool.
- Level: Primary metric
IOTaskExecTime
- Description: Execution time of IO tasks.
- Level: Primary metric
- Sub-metrics: CreateSegmentIter, DictDecode, GetDelVec, GetDeltaColumnGroup, GetRowsets, IOTime, LateMaterialize, ReadPKIndex, SegmentInit, SegmentRead
CreateSegmentIter
- Description: Time spent creating the Segment Iterator.
- Level: Secondary metric
DictDecode
- Description: Time spent on decoding dictionary for low cardinality optimization.
- Level: Secondary metric
GetDelVec
- Description: Time spent loading DelVec (delete vector).
- Level: Secondary metric
GetDeltaColumnGroup
- Description: Time spent loading DelVecColumnGroup.
- Level: Secondary metric
GetRowsets
- Description: Time spent loading RowSet.
- Level: Secondary metric
IOTime
- Description: Time spent on file I/O.
- Level: Secondary metric
LateMaterialize
- Description: Time spent on late materialization.
- Level: Secondary metric
ReadPKIndex
- Description: Time spent reading Primary Key index.
- Level: Secondary metric
SegmentInit
- Description: Time spent initializing the Segment.
- Level: Secondary metric
- Sub-metrics: BitmapIndexFilter, BitmapIndexFilterRows, BloomFilterFilter, BloomFilterFilterRows, ColumnIteratorInit, ShortKeyFilter, ShortKeyFilterRows, ShortKeyRangeNumber, RemainingRowsAfterShortKeyFilter, ZoneMapIndexFilter, ZoneMapIndexFilterRows, SegmentZoneMapFilterRows, SegmentRuntimeZoneMapFilterRows
BitmapIndexFilter
- Description: Time spent on Bitmap index filtering.
- Level: Tertiary metric
BitmapIndexFilterRows
- Description: Number of rows filtered by Bitmap index.
- Level: Tertiary metric
BloomFilterFilter
- Description: Time spent on Bloom filter indexing.
- Level: Tertiary metric
BloomFilterFilterRows
- Description: Number of rows filtered by Bloom filter.
- Level: Tertiary metric
ColumnIteratorInit
- Description: Time spent initializing the Column Iterator.
- Level: Tertiary metric
ShortKeyFilter
- Description: Time spent on ShortKey index filtering.
- Level: Tertiary metric
ShortKeyFilterRows
- Description: Number of rows filtered by ShortKey index.
- Level: Tertiary metric
ShortKeyRangeNumber
- Description: Number of ShortKey ranges.
- Level: Tertiary metric
RemainingRowsAfterShortKeyFilter
- Description: Number of rows remaining after ShortKey index filtering.
- Level: Tertiary metric
ZoneMapIndexFiter
- Description: Time spent on ZoneMap index filtering.
- Level: Tertiary metric
ZoneMapIndexFilterRows
- Description: Number of rows filtered by ZoneMap index.
- Level: Tertiary metric
SegmentZoneMapFilterRows
- Description: Number of rows filtered by Segment ZoneMap index.
- Level: Tertiary metric
SegmentRuntimeZoneMapFilterRows
- Description: Number of rows filtered by Segment Runtime ZoneMap index.
- Level: Tertiary metric
SegmentRead
- Description: Time spent reading the Segment.
- Level: Secondary metric
- Sub-metrics: BlockFetch, BlockFetchCount, BlockSeek, BlockSeekCount, ChunkCopy, DecompressT, DelVecFilterRows, PredFilter, PredFilterRows, RowsetsReadCount, SegmentsReadCount, TotalColumnsDataPageCount
BlockFetch
- Description: Time spent on Block fetch.
- Level: Tertiary metric
BlockFetchCount
- Description: Number of Block fetches.
- Level: Tertiary metric
BlockSeek
- Description: Time spent on Block seek.
- Level: Tertiary metric
BlockSeekCount
- Description: Number of Block seeks.
- Level: Tertiary metric
ChunkCopy
- Description: Time spent on Chunk copy.
- Level: Tertiary metric
DecompressT
- Description: Time spent on decompression.
- Level: Tertiary metric
DelVecFilterRows
- Description: Number of rows filtered by DELETE vector.
- Level: Tertiary metric
PredFilter
- Description: Time spent on predicate filtering.
- Level: Tertiary metric
PredFilterRows
- Description: Number of rows filtered by predicate.
- Level: Tertiary metric
RowsetsReadCount
- Description: Number of Rowsets reads.
- Level: Tertiary metric
SegmentsReadCount
- Description: Number of Segments reads.
- Level: Tertiary metric
TotalColumnsDataPageCount
- Description: Number of Column Data Pages.
- Level: Tertiary metric
IOTaskWaitTime
- Description: Waiting time from successful submission to scheduled execution of IO tasks.
- Level: Primary metric
SubmitTaskCount
- Description: Number of times IO tasks are submitted.
- Level: Primary metric
SubmitTaskTime
- Description: Time spent on task submission.
- Level: Primary metric
PeakIOTasks
- Description: Peak number of IO tasks.
- Level: Primary metric
PeakScanTaskQueueSize
- Description: Peak size of the IO task queue.
- Level: Primary metric
Connector Scan Operator
DataSourceType
- Description: Data source type, can be HiveDataSource, ESDataSource, and so on.
- Level: Primary Metric
Table
- Description: Table name.
- Level: Primary Metric
TabletCount
- Description: Number of tablets.
- Level: Primary Metric
MorselsCount
- Description: Number of morsels.
- Level: Primary Metric
Predicates
- Description: Predicate expression.
- Level: Primary Metric
PredicatesPartition
- Description: Predicate expression applied to partitions.
- Level: Primary Metric
SharedScan
- Description: Whether the
enable_shared_scanSession variable is enabled. - Level: Primary Metric
ChunkBufferCapacity
- Description: Capacity of the Chunk Buffer.
- Level: Primary Metric
DefaultChunkBufferCapacity
- Description: Default capacity of the Chunk Buffer.
- Level: Primary Metric
PeakChunkBufferMemoryUsage
- Description: Peak memory usage of the Chunk Buffer.
- Level: Primary Metric
PeakChunkBufferSize
- Description: Peak size of the Chunk Buffer.
- Level: Primary Metric
PrepareChunkSourceTime
- Description: Time taken to prepare the Chunk Source.
- Level: Primary Metric
ScanTime
- Description: Cumulative time for scanning. Scan operation is completed in the asynchronous I/O thread pool.
- Level: Primary Metric
IOTaskExecTime
- Description: Execution time of I/O tasks.
- Level: Primary Metric
- Sub-metrics: ColumnConvertTime, ColumnReadTime, ExprFilterTime, InputStream, ORC, OpenFile, ReaderInit, RowsRead, RowsSkip, ScanRanges, SharedBuffered
ColumnConvertTime
- Description: Time taken for column conversion.
- Level: Secondary Metric
ColumnReadTime
- Description: Time taken for reading and parsing data by the reader.
- Level: Secondary Metric
ExprFilterTime
- Description: Time taken for expression filtering.
- Level: Secondary Metric
InputStream
- Description: Used for classification purposes. It has no specific meaning.
- Level: Secondary Metric
- Sub-metrics: AppIOBytesRead, AppIOCounter, AppIOTime, FSIOBytesRead, FSIOCounter, FSIOTime
AppIOBytesRead
- Description: Amount of data read at the application layer.
- Level: Tertiary Metric
AppIOCounter
- Description: Number of I/O operations read at the application layer.
- Level: Tertiary Metric
AppIOTime
- Description: Cumulative reading time at the application layer.
- Level: Tertiary Metric
FSIOBytesRead
- Description: Amount of data read by the storage system.
- Level: Tertiary Metric
FSIOCounter
- Description: Number of I/O operations read by the storage layer.
- Level: Tertiary Metric
FSIOTime
- Description: Cumulative reading time by the storage layer.
- Level: Tertiary Metric
ORC
- Description: Used for classification purposes. It has no specific meaning.
- Level: Secondary Metric
- Sub-metrics: IcebergV2FormatTimer, StripeNumber, StripeSizes
IcebergV2FormatTimer
- Description: Time taken for format conversion.
- Level: Tertiary Metric
StripeNumber
- Description: Number of ORC files.
- Level: Tertiary Metric
StripeSizes
- Description: Average size of each stripe in ORC files.
- Level: Tertiary Metric
OpenFile
- Description: Time taken to open files.
- Level: Secondary Metric
ReaderInit
- Description: Time taken to initialize the reader.
- Level: Secondary Metric
RowsRead
- Description: Number of rows read.
- Level: Secondary Metric
RowsSkip
- Description: Number of rows skipped.
- Level: Secondary Metric
ScanRanges
- Description: Total number of data ranges scanned.
- Level: Secondary Metric
SharedBuffered
- Description: Used for classification purposes. It has no specific meaning.
- Level: Secondary Metric
- Sub-metrics: DirectIOBytes, DirectIOCount, DirectIOTime, SharedIOBytes, SharedIOCount, SharedIOTime
DirectIOBytes
- Description: Amount of data directly read by IO.
- Level: Tertiary Metric
DirectIOCount
- Description: Number of times direct IO is performed.
- Level: Tertiary Metric
DirectIOTime
- Description: Time taken for direct IO.
- Level: Tertiary Metric
SharedIOBytes
- Description: Amount of data read by shared IO.
- Level: Tertiary Metric
SharedIOCount
- Description: Number of times shared IO is performed.
- Level: Tertiary Metric
SharedIOTime
- Description: Time taken for shared IO.
- Level: Tertiary Metric
IOTaskWaitTime
- Description: Waiting time from successful submission to scheduled execution of IO tasks.
- Level: Primary Metric
SubmitTaskCount
- Description: Number of times IO tasks are submitted.
- Level: Primary Metric
SubmitTaskTime
- Description: Time taken to submit tasks.
- Level: Primary Metric
PeakIOTasks
- Description: Peak number of IO tasks.
- Level: Primary Metric
PeakScanTaskQueueSize
- Description: Peak size of the IO task queue.
- Level: Primary Metric
Exchange Operator
Exchange Sink Operator
ChannelNum
Description: Number of channels. Generally, the number of channels is equal to the number of receivers.
DestFragments
Description: List of destination FragmentInstance IDs.
DestID
Description: Destination node ID.
PartType
Description: Data distribution mode, including: UNPARTITIONED, RANDOM, HASH_PARTITIONED, and BUCKET_SHUFFLE_HASH_PARTITIONED.
SerializeChunkTime
Description: Time taken to serialize chunks.
SerializedBytes
Description: Size of serialized data.
ShuffleChunkAppendCounter
Description: Number of Chunk Append operations when PartType is HASH_PARTITIONED or BUCKET_SHUFFLE_HASH_PARTITIONED.
ShuffleChunkAppendTime
Description: Time taken for Chunk Append operations when PartType is HASH_PARTITIONED or BUCKET_SHUFFLE_HASH_PARTITIONED.
ShuffleHashTime
Description: Time taken to calculate hash when PartType is HASH_PARTITIONED or BUCKET_SHUFFLE_HASH_PARTITIONED.
RequestSent
Description: Number of data packets sent.
RequestUnsent
Description: Number of unsent data packets. This metric is non-zero when there is a short-circuit logic; otherwise, it is zero.
BytesSent
Description: Size of sent data.
BytesUnsent
Description: Size of unsent data. This metric is non-zero when there is a short-circuit logic; otherwise, it is zero.
BytesPassThrough
Description: If the destination node is the current node, data will not be transmitted over the network, which is called passthrough data. This metric indicates the size of such passthrough data. Passthrough is controlled by enable_exchange_pass_through.
PassThroughBufferPeakMemoryUsage
Description: Peak memory usage of the PassThrough Buffer.
CompressTime
Description: Compression time.
CompressedBytes
Description: Size of compressed data.
OverallThroughput
Description: Throughput rate.
NetworkTime
Description: Time taken for data packet transmission (excluding post-reception processing time).
NetworkBandwidth
Description: Estimated network bandwidth.
WaitTime
Description: Waiting time due to a full sender queue.
OverallTime
Description: Total time for the entire transmission process, i.e., from sending the first data packet to confirming the correct reception of the last data packet.
RpcAvgTime
Description: Average time for RPC.
RpcCount
Description: Total number of RPCs.
Exchange Source Operator
RequestReceived
Description: Size of received data packets.
BytesReceived
Description: Size of received data.
DecompressChunkTime
Description: Time taken to decompress chunks.
DeserializeChunkTime
Description: Time taken to deserialize chunks.
ClosureBlockCount
Description: Number of blocked Closures.
ClosureBlockTime
Description: Blocked time for Closures.
ReceiverProcessTotalTime
Description: Total time taken for receiver-side processing.
WaitLockTime
Description: Lock waiting time.
Aggregate Operator
GroupingKeys
Description: GROUP BY columns.
AggregateFunctions
Description: Time taken for aggregate function calculations.
AggComputeTime
Description: Time for AggregateFunctions + Group By.
ChunkBufferPeakMem
Description: Peak memory usage of the Chunk Buffer.
ChunkBufferPeakSize
Description: Peak size of the Chunk Buffer.
ExprComputeTime
Description: Time for expression computation.
ExprReleaseTime
Description: Time for expression release.
GetResultsTime
Description: Time to extract aggregate results.
HashTableSize
Description: Size of the Hash Table.
HashTableMemoryUsage
Description: Memory size of the Hash Table.
InputRowCount
Description: Number of input rows.
PassThroughRowCount
Description: In Auto mode, the number of data rows processed in streaming mode after low aggregation leads to degradation to streaming mode.
ResultAggAppendTime
Description: Time taken to append aggregate result columns.
ResultGroupByAppendTime
Description: Time taken to append Group By columns.
ResultIteratorTime
Description: Time to iterate over the Hash Table.
StreamingTime
Description: Processing time in streaming mode.
Join Operator
DistributionMode
Description: Distribution type, including: BROADCAST, PARTITIONED, COLOCATE, etc.
JoinPredicates
Description: Join predicates.
JoinType
Description: Join type.
BuildBuckets
Description: Number of buckets in the Hash Table.
BuildKeysPerBucket
Description: Number of keys per bucket in the Hash Table.
BuildConjunctEvaluateTime
Description: Time taken for conjunct evaluation during build phase.
BuildHashTableTime
Description: Time taken to build the Hash Table.
ProbeConjunctEvaluateTime
Description: Time taken for conjunct evaluation during probe phase.
SearchHashTableTimer
Description: Time taken to search the Hash Table.
CopyRightTableChunkTime
Description: Time taken to copy chunks from the right table.
HashTableMemoryUsage
Description: Memory usage of the Hash Table.
RuntimeFilterBuildTime
Description: Time taken to build runtime filters.
RuntimeFilterNum
Description: Number of runtime filters.
Window Function Operator
ProcessMode
Description: Execution mode, including two parts: the first part includes Materializing and Streaming; the second part includes Cumulative, RemovableCumulative, ByDefinition.
ComputeTime
Description: Time taken for window function calculations.
PartitionKeys
Description: Partition columns.
AggregateFunctions
Description: Aggregate functions.
ColumnResizeTime
Description: Time taken for column resizing.
PartitionSearchTime
Description: Time taken to search partition boundaries.
PeerGroupSearchTime
Description: Time taken to search Peer Group boundaries. Meaningful only when the window type is RANGE.
PeakBufferedRows
Description: Peak number of rows in the buffer.
RemoveUnusedRowsCount
Description: Number of times unused buffers are removed.
RemoveUnusedTotalRows
Description: Total number of rows removed from unused buffers.
Sort Operator
SortKeys
Description: Sorting keys.
SortType
Description: Query result sorting method: full sorting or sorting the top N results.
MaxBufferedBytes
Description: Peak size of buffered data.
MaxBufferedRows
Description: Peak number of buffered rows.
NumSortedRuns
Description: Number of sorted runs.
BuildingTime
Description: Time taken to maintain internal data structures during sorting.
MergingTime
Description: Time taken to merge sorted runs during sorting.
SortingTime
Description: Time taken for sorting.
OutputTime
Description: Time taken to build the output sorted sequence.
Merge Operator
For ease of understanding various metrics, Merge can be represented as the following state mechanism:
               ┌────────── PENDING ◄──────────┐
               │                              │
               │                              │
               ├──────────────◄───────────────┤
               │                              │
               ▼                              │
   INIT ──► PREPARE ──► SPLIT_CHUNK ──► FETCH_CHUNK ──► FINISHED
               ▲
               |
               | one traverse from leaf to root
               |
               ▼
            PROCESS
Limit
- Description: Limit.
- Level: Primary Metric
Offset
- Description: Offset.
- Level: Primary Metric
StreamingBatchSize
- Description: Size of data processed per Merge operation when Merge is performed in Streaming mode
- Level: Primary Metric
LateMaterializationMaxBufferChunkNum
- Description: Maximum number of chunks in the buffer when late materialization is enabled.
- Level: Primary Metric
OverallStageCount
- Description: Total execution count of all stages.
- Level: Primary Metric
- Sub-metrics: 1-InitStageCount, 2-PrepareStageCount, 3-ProcessStageCount, 4-SplitChunkStageCount, 5-FetchChunkStageCount, 6-PendingStageCount, 7-FinishedStageCount
1-InitStageCount
- Description: Execution count of the Init stage.
- Level: Secondary Metric
2-PrepareStageCount
- Description: Execution count of the Prepare stage.
- Level: Secondary Metric
3-ProcessStageCount
- Description: Execution count of the Process stage.
- Level: Secondary Metric
4-SplitChunkStageCount
- Description: Execution count of the SplitChunk stage.
- Level: Secondary Metric
5-FetchChunkStageCount
- Description: Execution count of the FetchChunk stage.
- Level: Secondary Metric
6-PendingStageCount
- Description: Execution count of the Pending stage.
- Level: Secondary Metric
7-FinishedStageCount
- Description: Execution count of the Finished stage.
- Level: Secondary Metric
OverallStageTime
- Description: Total execution time for each stage.
- Level: Primary metric
- Sub-metrics: 1-InitStageTime, 2-PrepareStageTime, 3-ProcessStageTime, 4-SplitChunkStageTime, 5-FetchChunkStageTime, 6-PendingStageTime, 7-FinishedStageTime
1-InitStageTime
- Description: Execution time for the Init stage.
- Level: Secondary metric
2-PrepareStageTime
- Description: Execution time for the Prepare stage.
- Level: Secondary metric
3-ProcessStageTime
- Description: Execution time for the Process stage.
- Level: Secondary metric
- Sub-metrics: LateMaterializationGenerateOrdinalTime, SortedRunProviderTime
LateMaterializationGenerateOrdinalTime
- Description: Time taken for generating ordinal columns during late materialization.
- Level: Tertiary Metric
SortedRunProviderTime
- Description: Time taken to retrieve data from the provider during the Process stage.
- Level: Tertiary Metric
4-SplitChunkStageTime
- Description: Time taken for the Split stage.
- Level: Secondary metric
5-FetchChunkStageTime
- Description: Time taken for the Fetch stage.
- Level: Secondary metric
6-PendingStageTime
- Description: Time taken for the Pending stage.
- Level: Secondary metric
7-FinishedStageTime
- Description: Time taken for the Finished stage.
- Level: Secondary metric
TableFunction Operator
TableFunctionExecTime
Description: Computation time for the Table Function.
TableFunctionExecCount
Description: Number of executions for the Table Function.
Project Operator
ExprComputeTime
Description: Computation time for expressions.
CommonSubExprComputeTime
Description: Computation time for common sub-expressions.
LocalExchange Operator
Type
Description: Type of Local Exchange, including: Passthrough, Partition, and Broadcast.
ShuffleNum
Description: Number of shuffles. This metric is only valid when Type is Partition.
LocalExchangePeakMemoryUsage
Description: Peak memory usage.
